Many people picture Canada as a country focused on its environment; they imagine lush forests, clear water and diverse wildlife. On this year’s Environmental Performance Index, Canada ranked 24th out of 178 countries. This is quite a slide from 2003, when Canada ranked sixth. For the past fourteen years Yale and Columbia universities have conducted a yearly worldwide study of the environmental laws and policies of different countries. Originally published in 2000 as the Environmental Sustainability Index, it is now known as the Environmental Performance Index (EPI). The purpose of the EPI is to encourage national leaders to address pressing environmental concerns and to work towards creating effective policies, strategies and environmental stewardship. The EPI consists of calculations made in 20 different categories that reflect national- level environmental data. According to Yale’s EPI website, the biggest objectives for the 2014 EPI were to better understand countries’ performance in two key categories: Environmental Health and Ecosystem Vitality. Environmental Health measures the protection of human health from environmental harm. Ecosystem Vitality measures ecosystem protection and resource management. These two main categories are divided into nine subcategories that focus on important environmental policy issues. In order to compare countries that are vastly different, values are standardized according to population, gross domestic product, and other factors. This standardized data is used to assess how close a country is to a specific policy target, which is defined by either international or national policy goals. Countries are then scored on a scale of 0 to 100, with 0 being the farthest from the target and 100 being the closest. This year’s EPI also incorporated penalties into their measurements. Countries were penalized if the national data they supplied was viewed as insufficient by experts or statistical analysts.
If a penalty is given, the country receives the lowest average in the subcategory in which insufficient data was used. Canadian environmentalists worry that Canada’s poor EPI ranking is a possible result of the overhaul of some of Canada’s federal environmental protection laws. “Canada has always had rather weak and flimsy laws to begin with,” says Stephanie Goodwin, director of Greenpeace B.C. “Now we have to fight just to keep whatever pieces of legislation we have left.” Australia, which ranked third on the 2014 EPI and had an overall score of 82.4 out of 100, beat Canada in seven of the nine EPI subcategories. Australian pollution laws allow for significant public input regarding how the policies are formed and amended. Australian legislation gives Australians a voice, allowing them to submit their opinions and ideas about new environmental protection policies. This creates a discussion between the government and its citizens.
Canada is failing to perform in several EPI categories: Fisheries, Biodiversity and Habitat, and Forestry.
Biodiversity and Habitat
Brunei Darussalam ranks 1st
Canada ranks 97th
Brunei Darussalam’s lush landscape.Biodiversity and Habitat is measured by four categories, one of which is National Terrestrial Protected Areas (National Biome Weight). The National Terrestrial Protected Areas evaluates the protection of each biome in a country in proportion to that country’s total biomes. A biome is defined by the Oxford Dictionary as “a large naturally occurring community of flora and fauna occupying a major habitat.” Nine countries share the top ranking, including Brunei Darussalam. As of 2012, 43.99 percent of Brunei’s total land area is protected, whereas only 10 percent of Canada’s total land area is protectedBrunei Darussalam’s lush landscape.
Fisheries
The Solomon Islands ranks 3rd
Canada ranks 71st
Fisheries are measured in two categories. Coastal Shelf Fishing Pressure measures the intensity of the impact that different fishing methods have on the seafloor, such as trawling and dredging. Fish Stocks measures how much a country’s fishing industry harvests, the species of fish caught, and whether or not their practice is sustainable. Scores in both categories are based on a scale from 0 to 100. Usually a country performs well in one category or the other, but not both. Currently, no country meets the EPI target for fish stocks. The country closest to meeting the standard for coastal fishing pressures is the Solomon Islands, scoring 99.77, whereas Canada scores 28.87.
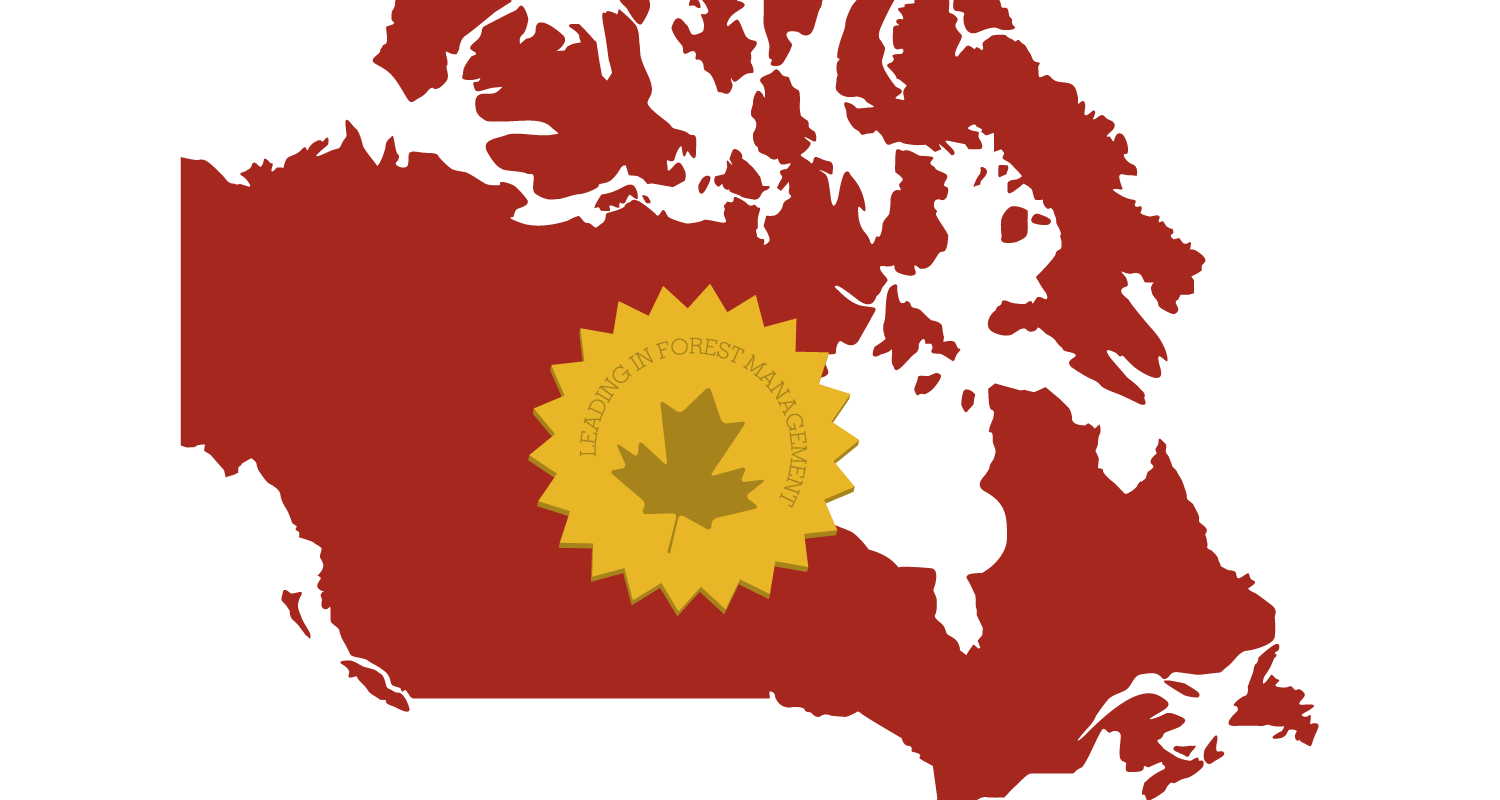
Forestry
Chile and New Zealand rank 1st
Canada ranks 104th
Forestry measures the loss and gain in forest-covered land. The amount of forest coverage can either positively or negatively affect climate control, carbon storage, water supply and biodiversity. A country can score 100 if they have improved their forest coverage, but will score lower if there is forest loss. Chile has improved forest coverage by 1.7 percent, and New Zealand has improved by 0.3 percent. Canada, on the other hand, has decreased forest coverage by 3.7 percent. Canada is also one of the world’s largest producers and exporters of softwood lumber.